Generate an eyeplot showing the distribution of posterior draws for selected drugs and adverse events
Source:R/pvEBayes_object_S3_methods.R
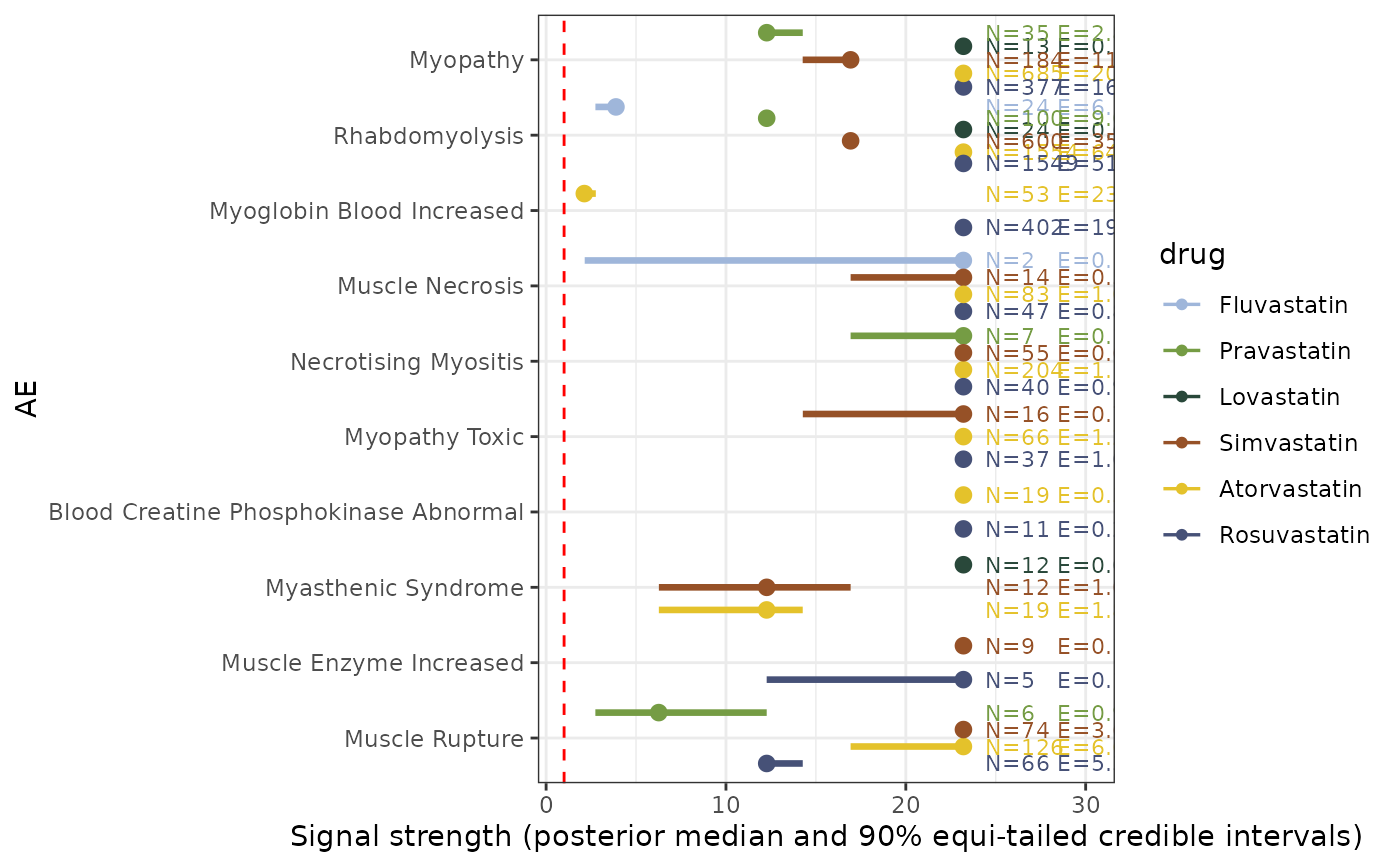
eyeplot_pvEBayes.RdThis function creates an eyeplot to visualize the posterior distributions of \(\lambda_{ij}\) for selected AEs and drugs. The plot displays posterior median, 90 percent credible interval for each selected AE-drug combination.
Usage
eyeplot_pvEBayes(
  x,
  num_top_AEs = 10,
  num_top_drugs = 8,
  specified_AEs = NULL,
  specified_drugs = NULL,
  N_threshold = 1,
  text_shift = 4,
  x_lim_scalar = 1.3,
  text_size = 3,
  log_scale = FALSE
)
Arguments
- x
a
pvEBayesobject, which is the output of the function pvEBayes or pvEBayes_tune.- num_top_AEs
a number of most significant AEs appearing in the plot. Default to 10.
- num_top_drugs
a number of most significant drugs appearing in the plot. Default to 7.
- specified_AEs
a vector of AE names that are specified to appear in the plot. If a vector of AEs is given, argument num_top_AEs will be ignored.
- specified_drugs
a vector of drug names that are specified to appear in the plot. If a vector of drugs is given, argument num_top_drugs will be ignored.
- N_threshold
a integer greater than 0. Any AE-drug combination with observation smaller than N_threshold will be filtered out.
- text_shift
numeric. Controls the relative position of text labels, (e.g., "N = 1", "E = 2"). A larger value shifts the "E = 2" further away from its original position.
- x_lim_scalar
numeric. An x-axis range scalar that ensures text labels are appropriately included in the plot.
- text_size
numeric. Controls the size of text labels, (e.g., "N = 1", "E = 2").
- log_scale
logical. If TRUE, the eye plot displays the posterior distribution of \(\log(\lambda_{ij})\) for the selected AEs and drugs.
Examples
fit <- pvEBayes(
  contin_table = statin2025_44, model = "general-gamma",
  alpha = 0.3, n_posterior_draws = 1000
)
#> ℹ Fitting general-gamma model...
#> ✔ Fitting general-gamma model... [221ms]
#>
#> ℹ Generating 1000 posterior draws...
#> ✔ Generating 1000 posterior draws... [39ms]
#>
#> Object of class 'pvEBayes'
#>
#> General-gamma model with hyperparameter alpha = 0.3.
#> Estimated prior is a mixture of 18 gamma distributions.
#>
#> Running time of the general-gamma model fitting: 0.229 seconds.
#> Optimizer convergence: successful.
#> Running time for posterior draws
#> (1000 signal strength posterior draws per AE-drug pair):0.0461 seconds.
#>
#> Extract estimated prior parameters, discovered signals
#> and signal strength posterior draws using `summary()`.

AE_names <- rownames(statin2025_44)[1:6]
drug_names <- colnames(statin2025_44)[-7]

eyeplot_pvEBayes(
  x = fit
)