Generate a heatmap plot visualizing posterior probabilities for selected drugs and adverse events
Source:R/pvEBayes_object_S3_methods.R
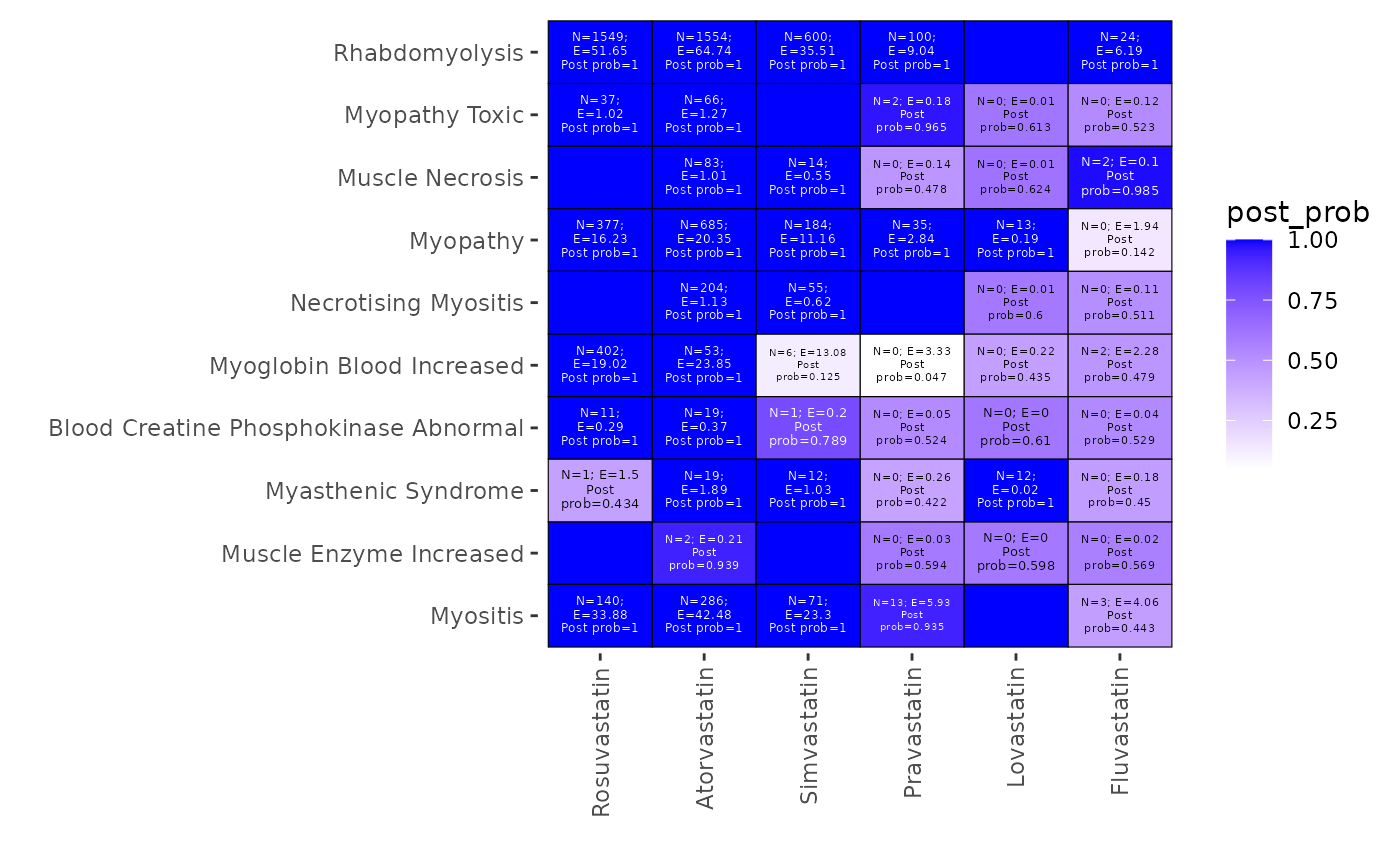
heatmap_pvEBayes.RdThis function generates a heatmap to visualize the posterior probabilities of being a signal for selected AEs and drugs.
Usage
heatmap_pvEBayes(
  x,
  num_top_AEs = 10,
  num_top_drugs = 8,
  specified_AEs = NULL,
  specified_drugs = NULL,
  cutoff_signal = NULL
)
Arguments
- x
a
pvEBayesobject, which is the output of the function pvEBayes or pvEBayes_tune.- num_top_AEs
number of most significant AEs appearing in the plot. Default to 10.
- num_top_drugs
number of most significant drugs appearing in the plot. Default to 7.
- specified_AEs
a vector of AE names that are specified to appear in the plot. If a vector of AEs is given, argument num_top_AEs will be ignored.
- specified_drugs
a vector of drug names that are specified to appear in the plot. If a vector of drugs is given, argument num_top_drugs will be ignored.
- cutoff_signal
numeric. Threshold for signal detection. An AE-drug combination is classified as a detected signal if its 5th posterior percentile exceeds this threshold.
Examples
fit <- pvEBayes(
  contin_table = statin2025_44, model = "general-gamma",
  alpha = 0.3, n_posterior_draws = 1000
)
#> ℹ Fitting general-gamma model...
#> ✔ Fitting general-gamma model... [221ms]
#>
#> ℹ Generating 1000 posterior draws...
#> ✔ Generating 1000 posterior draws... [36ms]
#>
#> Object of class 'pvEBayes'
#>
#> General-gamma model with hyperparameter alpha = 0.3.
#> Estimated prior is a mixture of 18 gamma distributions.
#>
#> Running time of the general-gamma model fitting: 0.2282 seconds.
#> Optimizer convergence: successful.
#> Running time for posterior draws
#> (1000 signal strength posterior draws per AE-drug pair):0.043 seconds.
#>
#> Extract estimated prior parameters, discovered signals
#> and signal strength posterior draws using `summary()`.


heatmap_pvEBayes(
  x = fit,
  num_top_AEs = 10,
  num_top_drugs = 8,
  specified_AEs = NULL,
  specified_drugs = NULL,
  cutoff_signal = 1.001
)